Skip to content
Artwork for Flash Stock Reports (Video)
BusinessInvesting

Flash Stock Reports (Video)

Flash by StockSentinel.AI

AI-generated deep dives on individual companies: business model, thesis, scenarios, and risks. Video explainer episodes.

Play
  • 237 episodes
  • daily
  • Avg 12 min
  • English
Counted on this page — what you have heard stays on this device, so it is not something the list can be paged by.
  • Today · 11 min· Video

    Cerebras Stock Fell 70% Despite A $25B AI Backlog

    Cerebras (CBRS) stock analysis: $25.4B backlog signals 77% upside — full deep dive 👉 Want this level of research on ANY COMPANY IN THE WORLD... for FREE? Check us out at: https://flash.stocksentinel.ai/?utm_source=rss_video&utm_medium=explainer_video&utm_campaign=freja_and_friends In this deep dive, we break down Cerebras Systems Inc. (CBRS) and its massive $25.4 billion backlog driven by proprietary wafer-scale AI inference technology and hyperscale partnerships with OpenAI and AWS. With core revenue growing 70% YoY in Q3 2026 and our probability-weighted 5-year model pointing to an intrinsic valuation of $144.88 against current $81.71 market levels, the key question for investors is whether its low-latency compute moat can overcome customer concentration and GAAP operating losses. Here’s everything you need to know before making a decision on CBRS. 🎯 SECTIONS: • Executive Summary & Company Overview • Wafer-Scale AI Architecture (WSE-3) vs. Traditional GPU Bottlenecks • Market Opportunity & Real-Time Inference Competitive Moat • Q3 2026 Earnings Breakdown & Raised FY2026 Revenue Guidance • Commercial Scale: OpenAI 750 MW Deal, AWS Bedrock & Oracle Cloud • Key Investment Risks: TSMC Foundry Dependence & Customer Concentration • 5-Year Scenario Valuation Model: Bull, Base & Bear Price Targets • Qualitative Scorecard & Wall Street Consensus Outlook • Final Verdict & CBRS Stock Price Target Analysis All the research behind this video was created using Flash by StockSentinel.ai. Flash gives viewers FREE access to institutional-grade investment research reports on any public company in the world. Free features include: ✅ Explainer Videos ✅ Audio Podcasts ✅ Detailed Reports ✅ Investor Presentations with full qualitative and quantitative analysis Subscribers also unlock: ✅ Best Ideas Now (6 highest-conviction picks every Saturday) ✅ Portfolio Watch ✅ Insider IQ (alerts on significant global insider buying activity) ✅ Flash Community Subscribe + 🔔 to never miss a stock report DISCLAIMER: This content is for informational and educational purposes only and is not investment advice. Opinions are personal and may change. Do your own research or consult a licensed professional. StockSentinel.ai is under no obligation to update this information. #StockAnalysis #StockMarket #Investing #Stocks #ValueInvesting #StockResearch #InvestmentAnalysis #FinancialAnalysis #CBRS #CerebrasSystems #CBRSStock #CBRSAnalysis #TechStocks #AIStocks #SemiconductorStocks #FundamentalAnalysis #ValuationAnalysis #NASDAQ

  • Yesterday · 11 min· Video

    Evergy's $21B AI Power Surge Wall Street Missed

    EVRG stock analysis: $21.6B data center pivot sparks 11.5% growth — valuation deep dive 👉 Want this level of research on ANY COMPANY IN THE WORLD... for FREE? Check us out at: https://flash.stocksentinel.ai/?utm_source=rss_video&utm_medium=explainer_video&utm_campaign=freja_and_friends In this deep dive, we break down Evergy, Inc. (EVRG) and its massive $21.6 billion capital investment plan driving a 2.5 GW to 3.0 GW surge in regional data center demand. With shares trading at 20.0 times forward earnings and rate base compounding at 11.5% annually, the key question for investors is whether this regulated utility monopoly is an undervalued AI power play or vulnerable to regulatory lag and debt dilution. Here’s everything you need to know before making a decision on EVRG. 🎯 SECTIONS: • Evergy (EVRG) Business Overview & Monopoly Footprint • The Economic Moat: Rate-Regulated Tariffs & SPP Grid • Hyperscale Data Center Pipeline & 2.5–3.0 GW Surge • The $21.6B Capex Plan & 11.5% Rate Base Growth • Q3 2026 Earnings Beat & Upward Guidance Revision • Dividend Growth Profile, Yield & Payout Stability • Peer Comparison: Evergy vs. Ameren, Xcel & CMS Energy • Valuation Multiples & Wall Street Price Targets • Key Risks: KCC ROE Caps, Regulatory Lag & Balance Sheet Leverage • Bull vs. Bear Case: Is EVRG Stock a Buy, Sell, or Hold? All the research behind this video was created using Flash by StockSentinel.ai, giving you free access to institutional-grade investment research reports on any public company in the world. Our free research platform includes: ✅ Explainer Videos ✅ Audio Podcasts ✅ Detailed Reports ✅ Investor Presentations with full qualitative and quantitative analysis For investors looking for an added advantage, premium Flash subscribers also unlock: ✅ Best Ideas Now (6 highest-conviction picks every Saturday) ✅ Portfolio Watch ✅ Insider IQ (alerts on significant global insider buying activity) ✅ Flash Community Subscribe + 🔔 to never miss a stock report DISCLAIMER: This content is for informational and educational purposes only and is not investment advice. Opinions are personal and may change. Do your own research or consult a licensed professional. StockSentinel.ai is under no obligation to update this information. #StockAnalysis #StockMarket #Investing #Stocks #ValueInvesting #StockResearch #InvestmentAnalysis #FinancialAnalysis #EVRG #Evergy #EVRGStock #EVRGAnalysis #UtilityStocks #EnergyStocks #FundamentalAnalysis #ValuationAnalysis #WallStreet #NASDAQ

  • Yesterday · 13 min· Video

    CRDO Grew 115%, But 4 Customers Control 84% of Revenue

    Credo (CRDO) stock analysis: 115% growth at 49% margins — buy or sell valuation 👉 Want this level of research on ANY COMPANY IN THE WORLD... for FREE? Check us out at: https://flash.stocksentinel.ai/?utm_source=rss_video&utm_medium=explainer_video&utm_campaign=freja_and_friends In this deep dive, we break down Credo Technology Group Holding Ltd (CRDO) and its critical role in solving the physical power and bandwidth bottlenecks throttling modern AI data centers. With revenue growing 115% YoY, non-GAAP net margins expanding to 49%, and shares trading at roughly 28.5 times forward earnings following a post-earnings pullback, the key question for investors is whether its high-growth AI interconnect moat outweighs extreme customer concentration. Here’s everything you need to know before making a decision on CRDO. 🎯 SECTIONS: • Executive Summary & AI Connectivity Business Model • The Technical Shift: Active Electrical Cables (AECs) vs. Optical DSPs • Competitive Landscape: Credo vs. Marvell, Broadcom & Astera Labs • Financial Performance: 115% Revenue Growth & Operating Margin Leverage • Structural Risks: 84% Hyperscaler Concentration & Co-Packaged Optics • 5-Year Valuation Model: Bull, Base, and Bear Case Scenarios • Probability-Weighted Target Price & Qualitative Scorecard • Technical Analysis, Moving Averages & Final Buy or Sell Verdict All the research behind this video was created using Flash by StockSentinel.ai, giving you FREE access to institutional-grade investment research reports on any public company in the world. Free features include: ✅ Explainer Videos ✅ Audio Podcasts ✅ Detailed Reports ✅ Investor Presentations with full qualitative and quantitative analysis Subscribers also unlock: ✅ Best Ideas Now (6 highest-conviction picks every Saturday) ✅ Portfolio Watch ✅ Insider IQ (alerts on significant global insider buying activity) ✅ Flash Community Subscribe + 🔔 to never miss a stock report DISCLAIMER: This content is for informational and educational purposes only and is not investment advice. Opinions are personal and may change. Do your own research or consult a licensed professional. StockSentinel.ai is under no obligation to update this information. #StockAnalysis #StockMarket #Investing #Stocks #ValueInvesting #StockResearch #InvestmentAnalysis #FinancialAnalysis #CRDO #CredoTechnology #CRDOStock #CRDOAnalysis #SemiconductorStocks #AIStocks #TechStocks #FundamentalAnalysis #ValuationAnalysis #NASDAQ #WallStreet
  • Yesterday · 11 min· Video

    RSKD Surged 41% But Margins Tell Another Story

    Riskified (RSKD) stock analysis: 41% revenue surge sparks turnaround — deep dive 👉 Want this level of research on ANY COMPANY IN THE WORLD... for FREE? Check us out at: https://flash.stocksentinel.ai/?utm_source=rss_video&utm_medium=explainer_video&utm_campaign=freja_and_friends In this deep dive, we break down Riskified Ltd. (RSKD) and its accelerating operational turnaround driven by 41% revenue growth and surging enterprise AI adoption. With the company holding $235 million in net cash, raising full-year revenue guidance to $430 million, and generating record free cash flow, the key question for investors is whether current valuations offer asymmetric upside or if gross margin compression poses too great a risk. Here’s everything you need to know before making a decision on RSKD. 🎯 SECTIONS: • Riskified (RSKD) Executive Summary & Core Business Model • The 100% Chargeback Guarantee & AI Decision Engine • Economic Moat, Network Effects & $170B+ Reviewed GMV • Q3 2026 Earnings Breakdown: 41% Growth & Guidance Raise • Balance Sheet Strength: $235M Net Cash & Zero Debt • Critical Risks: Gross Margin Compression & Merchant Churn • 5-Year Valuation Scenarios & Long-Term Price Targets • Bull vs. Bear Case: Final RSKD Investment Verdict All the institutional-grade research behind this video was created using Flash by StockSentinel.ai. Flash gives viewers FREE access to comprehensive investment research reports on any public company in the world. Your free access includes: ✅ Explainer Videos ✅ Audio Podcasts ✅ Detailed Reports ✅ Investor Presentations with full qualitative and quantitative analysis Subscribers also unlock: ✅ Best Ideas Now (6 highest-conviction picks every Saturday) ✅ Portfolio Watch ✅ Insider IQ (alerts on significant global insider buying activity) ✅ Flash Community Subscribe + 🔔 to never miss a stock report DISCLAIMER: This content is for informational and educational purposes only and is not investment advice. Opinions are personal and may change. Do your own research or consult a licensed professional. StockSentinel.ai is under no obligation to update this information. #StockAnalysis #StockMarket #Investing #Stocks #ValueInvesting #StockResearch #InvestmentAnalysis #FinancialAnalysis #RSKD #Riskified #RSKDStock #RSKDAnalysis #TechStocks #AIStocks #FintechStocks #FundamentalAnalysis #ValuationAnalysis #DueDiligence #WallStreet #NYSE

  • Wednesday · 14 min· Video

    Wall Street Is Mispricing SOXX at 20x Earnings

    SOXX stock analysis: model projects 120% upside to $323 — valuation breakdown 👉 Want this level of research on ANY COMPANY IN THE WORLD... for FREE? Check us out at: https://flash.stocksentinel.ai/?utm_source=rss_video&utm_medium=explainer_video&utm_campaign=freja_and_friends In this deep dive, we break down iShares Semiconductor ETF (SOXX) and its strategic exposure to the structural AI hardware boom and the expanding $1 trillion semiconductor market. With portfolio holdings trading at an aggregate 19.97x prospective earnings alongside a 5-year probability-weighted price target of $323.35 (+120.7% upside), the key question for investors is whether surging data center capex can overcome Taiwan manufacturing concentration and cyclical inventory risks. Here’s everything you need to know before making a decision on SOXX. 🎯 SECTIONS: • Executive Summary & Index Capping Methodology • The $1T Semiconductor Supercycle & AI Hardware Drivers • Top Holdings Breakdown: NVIDIA, AMD, and Broadcom Earnings • Valuation Analysis & Portfolio P/E Multiples • Critical Risks: Taiwan Geopolitics & Capex Digestion • 5-Year Scenario Model & Price Target Forecast • Qualitative Scorecard & Buy or Sell Thesis All the research behind this video was created using Flash by StockSentinel.ai. Flash gives viewers FREE access to investment research reports on any public company. The FREE features include: ✅ Explainer Videos ✅ Audio Podcasts ✅ Detailed Reports ✅ Investor Presentations with full qualitative and quantitative analysis Subscribers also unlock: ✅ Best Ideas Now (6 highest-conviction picks every Saturday) ✅ Portfolio Watch ✅ Insider IQ (alerts on significant global insider buying activity) ✅ Flash Community Subscribe + 🔔 to never miss a stock report DISCLAIMER: This content is for informational and educational purposes only and is not investment advice. Opinions are personal and may change. Do your own research or consult a licensed professional. StockSentinel.ai is under no obligation to update this information. #StockAnalysis #StockMarket #Investing #Stocks #ValueInvesting #StockResearch #InvestmentAnalysis #FinancialAnalysis #SOXX #iSharesSemiconductorETF #SOXXStock #SOXXAnalysis #SemiconductorStocks #TechStocks #AIStocks #FundamentalAnalysis #ValuationAnalysis #WallStreet #NASDAQ

  • Wednesday · 12 min· Video

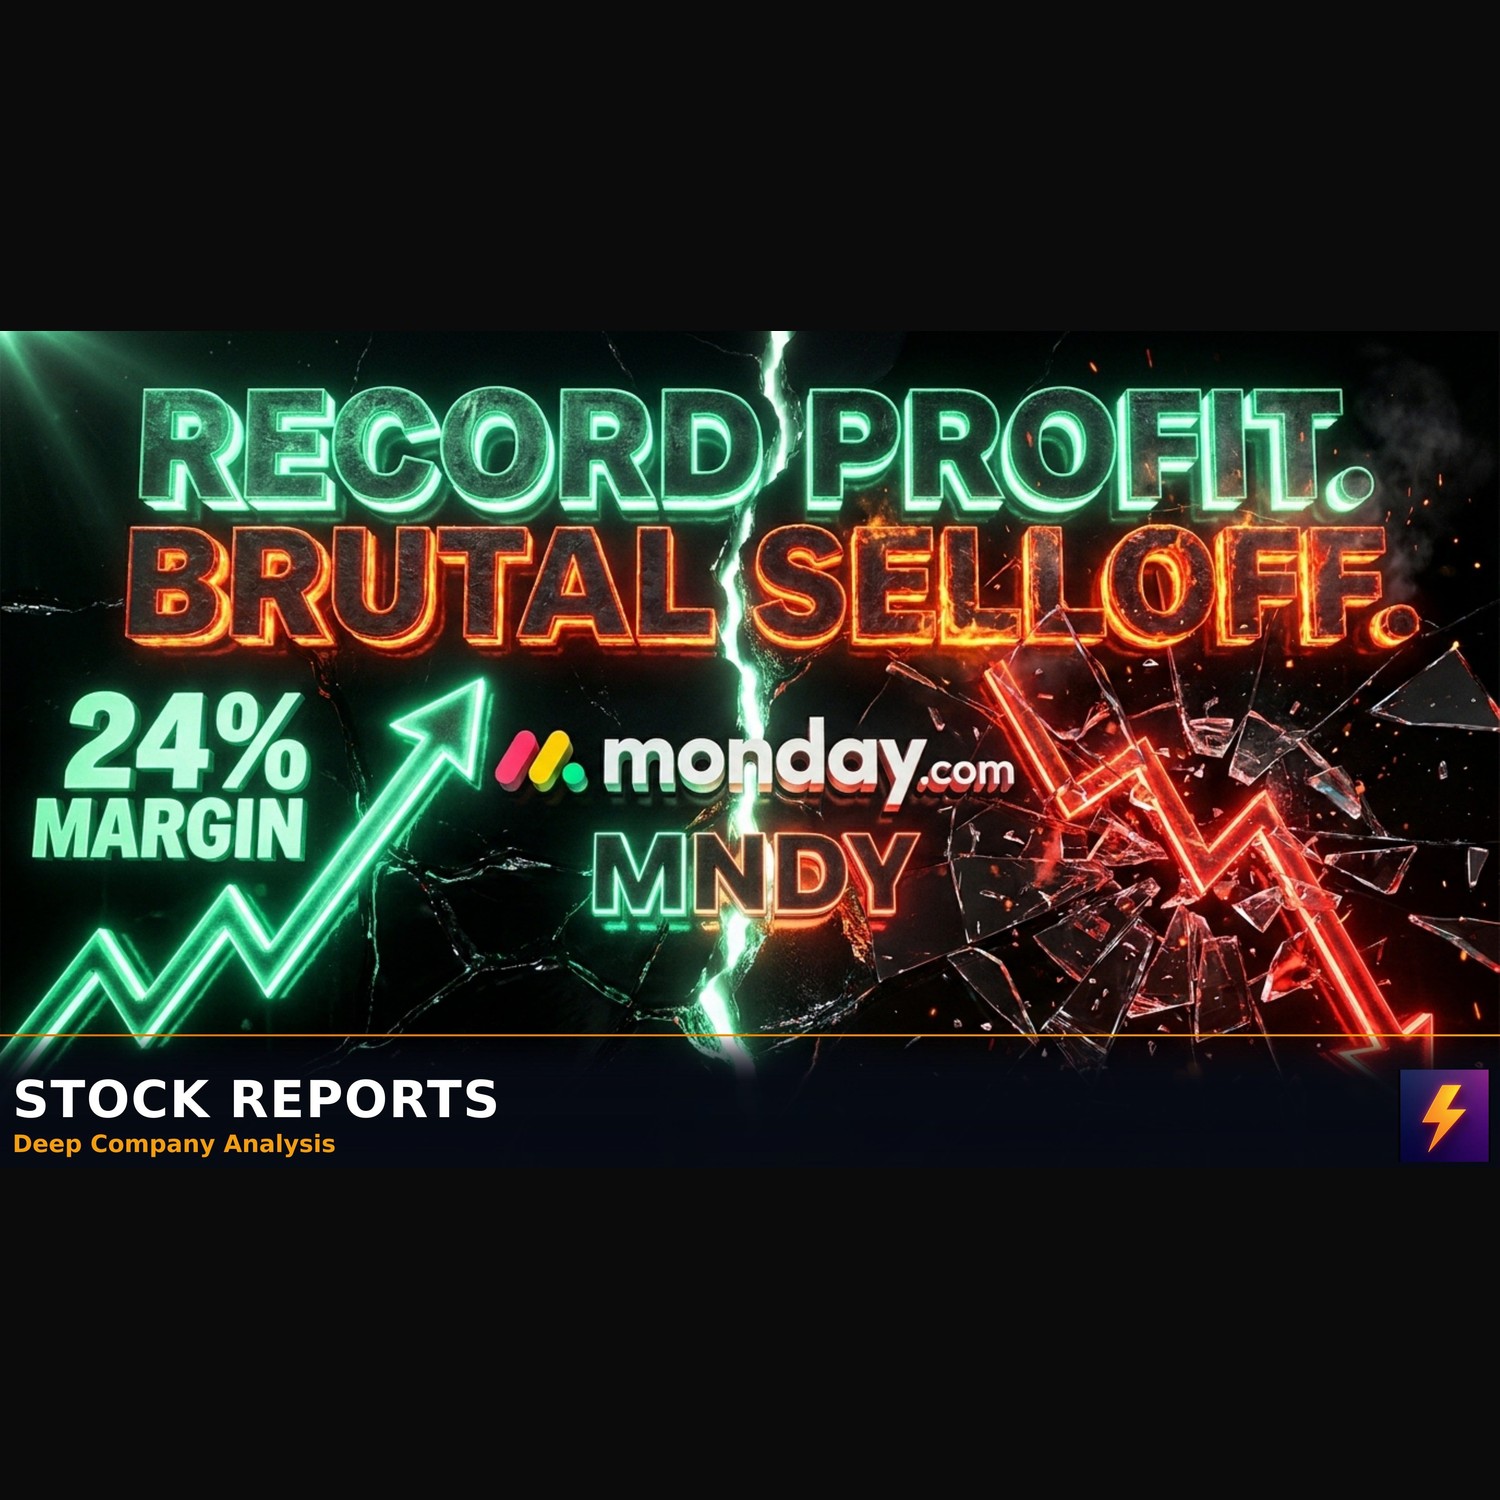
    Wall Street Dumped MNDY Despite Record 24% Margins

    MNDY stock analysis: 24% record margin triggers sell-off — valuation deep dive 👉 Want this level of research on ANY COMPANY IN THE WORLD... for FREE? Check us out at: https://flash.stocksentinel.ai/?utm_source=rss_video&utm_medium=explainer_video&utm_campaign=freja_and_friends In this deep dive, we break down [suspicious link removed] (MNDY) and how record 24% operating margins clashed with decelerating top-line guidance and multiple Wall Street downgrades. With shares trading at just 1.6x enterprise value to sales and roughly 10x forward earnings alongside $1.1 billion in net balance sheet cash, the key question for investors is whether downmarket churn poses a structural threat or creates an asymmetric value buying opportunity. Here’s everything you need to know before making a decision on MNDY. 🎯 SECTIONS: • Executive Summary: Work OS Platform & Global Footprint • Business Model: Tiered SaaS & AI Credit Monetization • Product Suite & Architecture: CRM, Dev, and Service Operations • GenAI Ecosystem: Autonomous Agents & monday vibe Scale • Q3 FY26 Earnings Breakdown: 24% Margins vs. Growth Deceleration • Risk Analysis: Downmarket Churn, Seat Reductions & FX Headwinds • Valuation Deep Dive: Multiples Compression & Balance Sheet Cash • 5-Year Scenario Model: Bull, Base, and Bear Price Targets All the research behind this video was created using Flash by StockSentinel.ai, giving viewers completely FREE access to institutional-grade investment research reports on any public company in the world. Your free Flash access includes: ✅ Explainer Videos ✅ Audio Podcasts ✅ Detailed Reports ✅ Investor Presentations with full qualitative and quantitative analysis Looking for even higher conviction? Flash subscribers also unlock: ✅ Best Ideas Now (6 highest-conviction picks every Saturday) ✅ Portfolio Watch ✅ Insider IQ (alerts on significant global insider buying activity) ✅ Flash Community Subscribe + 🔔 to never miss a stock report DISCLAIMER: This content is for informational and educational purposes only and is not investment advice. Opinions are personal and may change. Do your own research or consult a licensed professional. StockSentinel.ai is under no obligation to update this information. #StockAnalysis #StockMarket #Investing #Stocks #ValueInvesting #StockResearch #InvestmentAnalysis #FinancialAnalysis #MNDY #MondayCom #MNDYStock #MNDYAnalysis #TechStocks #AIStocks #FundamentalAnalysis #ValuationAnalysis #NASDAQ #WallStreet

  • Wednesday · 11 min· Video

    CoreWeave's $132B Backlog Has a $47B Debt Problem

    CoreWeave (CRWV) stock analysis: $132B backlog vs $47B debt — buy or sell? 👉 Want this level of research on ANY COMPANY IN THE WORLD... for FREE? Check us out at: https://flash.stocksentinel.ai/?utm_source=rss_video&utm_medium=explainer_video&utm_campaign=freja_and_friends In this deep dive, we break down CoreWeave Inc (CRWV) and its explosive growth as an AI neocloud hyperscaler backed by a staggering $132.5 billion contract backlog. With revenue growing 168% year-over-year to $3.66 billion but weighed down by over $46.9 billion in total debt and soaring interest costs, the key question for investors is whether its dominant GPU infrastructure moat justifies the financial leverage risk. Here’s everything you need to know before making a decision on CRWV. 🎯 SECTIONS: • CoreWeave (CRWV) Business Model & Neocloud Overview • AI Cloud Infrastructure & GPU Cluster Architecture • NVIDIA Strategic Partnership & Silicon Moat Analysis • Q3 2026 Financial Results & Backlog Surge • Debt Profile, Capital Structure & Interest Expense Risk • Valuation Multiples (EV/Sales, P/S) & Price Target Analysis • Long-Term Catalysts, Downside Risks & Investment Verdict All the research behind this video was created using Flash by StockSentinel.ai. Flash gives viewers FREE access to investment research reports on any public company. The FREE features include: ✅ Explainer Videos ✅ Audio Podcasts ✅ Detailed Reports ✅ Investor Presentations with full qualitative and quantitative analysis Subscribers also unlock: ✅ Best Ideas Now (6 highest-conviction picks every Saturday) ✅ Portfolio Watch ✅ Insider IQ (alerts on significant global insider buying activity) ✅ Flash Community Subscribe + 🔔 to never miss a stock report DISCLAIMER: This content is for informational and educational purposes only and is not investment advice. Opinions are personal and may change. Do your own research or consult a licensed professional. StockSentinel.ai is under no obligation to update this information. #StockAnalysis #StockMarket #Investing #Stocks #ValueInvesting #StockResearch #InvestmentAnalysis #FinancialAnalysis #CRWV #CoreWeave #CRWVStock #CRWVAnalysis #AIStocks #TechStocks #FundamentalAnalysis #ValuationAnalysis #NASDAQ #WallStreet
  • Tuesday · 10 min· Video

    HROW Slashed Guidance, but Wall Street Sees 140% Upside

    Harrow (HROW) stock analysis: 75% VEVYE growth vs debt — buy or sell deep dive 👉 Want this level of research on ANY COMPANY IN THE WORLD... for FREE? Check us out at: https://flash.stocksentinel.ai/?utm_source=rss_video&utm_medium=explainer_video&utm_campaign=freja_and_friends In this deep dive, we break down Harrow, Inc. (HROW) and its aggressive commercial pivot from generic compounding into high-margin branded ophthalmic pharmaceuticals driven by VEVYE and TYRVAYA. With Q3 revenues growing 39% YoY to $99.3 million and shares trading at an EV-to-forward-sales multiple of 3.5x near 52-week lows, the key question for investors is whether accelerating branded operating leverage can overcome its $300 million debt burden. Here’s everything you need to know before making a decision on HROW. 🎯 SECTIONS: • Executive Summary & Strategic Company Overview • Business Model & Core Branded Portfolio (VEVYE, TYRVAYA, IHEEZO) • Distribution Advantages & Economic Moat Analysis • Total Addressable Market & Competitor Comparison • Q3 Financial Performance & Earnings Breakdown • Balance Sheet, Debt Burden & Cash Flow Risks • 5-Year Scenario Analysis & Long-Term Price Targets • Qualitative Scorecard & Management Alignment • Key Catalysts & Final Investment Thesis • Technical Analysis & Valuation Outlook All the research behind this video was created using Flash by StockSentinel.ai. Flash gives viewers FREE access to institutional-grade investment research reports on any public company in the world. The FREE features include: ✅ Explainer Videos ✅ Audio Podcasts ✅ Detailed Reports ✅ Investor Presentations with full qualitative and quantitative analysis Subscribers also unlock: ✅ Best Ideas Now (6 highest-conviction picks every Saturday) ✅ Portfolio Watch ✅ Insider IQ (alerts on significant global insider buying activity) ✅ Flash Community Subscribe + 🔔 to never miss a stock report DISCLAIMER: This content is for informational and educational purposes only and is not investment advice. Opinions are personal and may change. Do your own research or consult a licensed professional. StockSentinel.ai is under no obligation to update this information. #StockAnalysis #StockMarket #Investing #Stocks #ValueInvesting #StockResearch #InvestmentAnalysis #FinancialAnalysis #HROW #HarrowInc #HROWStock #HROWAnalysis #HealthcareStocks #PharmaStocks #DeepDive #FundamentalAnalysis #ValuationAnalysis #WallStreet #NASDAQ

  • Tuesday · 17 min· Video

    HRTX Selling All Assets: The $222M Valuation Gap

    HRTX stock analysis: $222M buyout sparks 162% upside — full valuation deep dive 👉 Want this level of research on ANY COMPANY IN THE WORLD... for FREE? Check us out at: https://flash.stocksentinel.ai/?utm_source=rss_video&utm_medium=explainer_video&utm_campaign=freja_and_friends In this deep dive, we break down Heron Therapeutics, Inc. (HRTX) and its landmark definitive agreement to sell substantially all operating assets to CorMedix for $222.6 million in upfront consideration. With shares trading near $0.29 at just 0.53 times trailing sales against $126 million in total debt obligations, the key question for investors is whether this merger arbitrage setup unlocks a 162% base-case recovery or carries severe downside liquidation risk. Here’s everything you need to know before making a decision on HRTX. 🎯 SECTIONS: • Executive Summary & CorMedix M&A Acquisition Structure • Commercial Drug Portfolio: ZYNRELEF, APONVIE & CINVANTI • Economic Moats, Generic Headwinds & NOPAIN Act Catalysts • Q3 2026 Earnings Breakdown & Balance Sheet Leverage • Valuation Analysis: Merger Arbitrage & Net Asset Value (NAV) • 5-Year Scenario Analysis: Base, Bull & Liquidation Cases • Qualitative Scorecard & Core Risk Assessment All the research behind this video was created using Flash by StockSentinel.ai. Flash gives viewers FREE access to investment research reports on any public company. The FREE features include: ✅ Explainer Videos ✅ Audio Podcasts ✅ Detailed Reports ✅ Investor Presentations with full qualitative and quantitative analysis Subscribers also unlock: ✅ Best Ideas Now (6 highest-conviction picks every Saturday) ✅ Portfolio Watch ✅ Insider IQ (alerts on significant global insider buying activity) ✅ Flash Community Subscribe + 🔔 to never miss a stock report DISCLAIMER: This content is for informational and educational purposes only and is not investment advice. Opinions are personal and may change. Do your own research or consult a licensed professional. StockSentinel.ai is under no obligation to update this information. #StockAnalysis #StockMarket #Investing #Stocks #ValueInvesting #StockResearch #InvestmentAnalysis #FinancialAnalysis #HRTX #HeronTherapeutics #HRTXStock #HRTXAnalysis #HealthcareStocks #BiotechStocks #FundamentalAnalysis #ValuationAnalysis #DueDiligence #NASDAQ

  • Tuesday · 11 min· Video

    Why Trade Desk Is Wall Street's Biggest Blind Spot

    Trade Desk (TTD) stock analysis: 7x EBITDA & $1.2B cash — buy or sell deep dive 👉 Want this level of research on ANY COMPANY IN THE WORLD... for FREE? Check us out at: https://flash.stocksentinel.ai/?utm_source=rss_video&utm_medium=explainer_video&utm_campaign=freja_and_friends In this deep dive, we break down The Trade Desk (TTD) and its asymmetric recovery setup following strong Q3 beats, accelerating Connected TV market share, and aggressive rollout of agentic AI ad infrastructure. With shares trading at just ~7x EV/EBITDA and ~2x sales alongside a zero-debt balance sheet holding $1.23 billion in net cash, the key question for investors is whether current market pessimism creates a generational buying opportunity or signals structural ad-tech headwinds. Here’s everything you need to know before making a decision on TTD. 🎯 SECTIONS: • The Trade Desk (TTD) Business Model & Take Rate Explained • Connected TV (CTV) & Retail Media Growth Drivers • Economic Moat vs. Google & Walled Gardens • Q3 Earnings Beat & Financial Results Analysis • Balance Sheet Breakdown: $1.23B Net Cash & Buybacks • Key Investment Risks: Headwinds, AI Competition & Dilution • 5-Year Valuation Scenarios & Stock Price Targets (2026–2031) • Qualitative Scorecard & Buy or Sell Verdict All the research behind this deep dive was generated using Flash by StockSentinel.ai. Flash gives you completely FREE access to institutional-grade investment research reports on any public company in the world. Your free access includes: ✅ Explainer Videos ✅ Audio Podcasts ✅ Detailed Reports ✅ Investor Presentations with full qualitative and quantitative analysis Looking for an edge? Upgraded subscribers also unlock: ✅ Best Ideas Now (6 highest-conviction picks every Saturday) ✅ Portfolio Watch ✅ Insider IQ (alerts on significant global insider buying activity) ✅ Flash Community Subscribe + 🔔 to never miss a stock report DISCLAIMER: This content is for informational and educational purposes only and is not investment advice. Opinions are personal and may change. Do your own research or consult a licensed professional. StockSentinel.ai is under no obligation to update this information. #StockAnalysis #StockMarket #Investing #Stocks #ValueInvesting #StockResearch #InvestmentAnalysis #FinancialAnalysis #TTD #TheTradeDesk #TTDStock #TTDAnalysis #TechStocks #AIStocks #DeepDive #FundamentalAnalysis #ValuationAnalysis #WallStreet #NASDAQ

  • Monday · 9 min· Video

    Energy Fuels: The $932M Critical Minerals Moat

    Energy Fuels (UUUU) holds $932M cash backing pivot — stock analysis & valuation 👉 Want this level of research on ANY COMPANY IN THE WORLD... for FREE? Check us out at: https://flash.stocksentinel.ai/?utm_source=rss_video&utm_medium=explainer_video&utm_campaign=freja_and_friends In this deep dive, we break down Energy Fuels Inc. (UUUU) and its strategic transition into an integrated Western critical minerals producer anchored by the White Mesa Mill. With Q3 revenue growing 64.77% YoY to $29.18 million and over $932 million in working capital backing its balance sheet, the key question for investors is whether its mine-to-magnet rare earth expansion creates massive long-term upside despite short-term GAAP earnings volatility. Here’s everything you need to know before making a decision on UUUU. 🎯 SECTIONS: - Executive Summary & Critical Minerals Overview - Business Drivers & Mine-to-Magnet Strategy - Economic Moat & Competitive Landscape - Q3 2026 Financial Results & Revenue Analysis - Balance Sheet Liquidity & SOTP Valuation - Comprehensive Risk Assessment & Matrix - 5-Year Scenario Analysis & Price Targets - Qualitative Scorecard & Final Investment Thesis All the research behind this video was created using Flash by StockSentinel.ai. Flash gives viewers FREE access to investment research reports on any public company. Free features include: ✅ Explainer Videos ✅ Audio Podcasts ✅ Detailed Reports ✅ Investor Presentations with full qualitative and quantitative analysis Subscribers also unlock: ✅ Best Ideas Now (6 highest-conviction picks every Saturday) ✅ Portfolio Watch ✅ Insider IQ (alerts on significant global insider buying activity) ✅ Flash Community Subscribe + 🔔 to never miss a stock report DISCLAIMER: This content is for informational and educational purposes only and is not investment advice. Opinions are personal and may change. Do your own research or consult a licensed professional. StockSentinel.ai is under no obligation to update this information. #StockAnalysis #StockMarket #Investing #Stocks #ValueInvesting #StockResearch #InvestmentAnalysis #FinancialAnalysis #UUUU #EnergyFuels #UUUUStock #UUUUAnalysis #EnergyStocks #UraniumStocks #DeepDive #FundamentalAnalysis #ValuationAnalysis #WallStreet #Finance

  • Monday · 11 min· Video

    ServiceNow Stock Fell 17% But AI Growth Surged 70%

    ServiceNow (NOW) stock analysis: $1.7B AI target & 98% renewal rate — buy or sell? 👉 Want this level of research on ANY COMPANY IN THE WORLD... for FREE? Check us out at: https://flash.stocksentinel.ai/?utm_source=rss_video&utm_medium=explainer_video&utm_campaign=freja_and_friends In this deep dive, we break down ServiceNow Inc (NOW) and its rapidly expanding enterprise AI initiatives anchored by a raised $1.7 billion Annual Contract Value target. With subscription revenue growing 22.5% YoY and an industry-leading 98% renewal rate, the key question for investors is whether the recent pullback creates a prime buying opportunity or signals near-term margin pressure. Here’s everything you need to know before making a decision on NOW. 🎯 SECTIONS: • Executive Summary & Core Platform Overview • Four Workflow Pillars & SaaS Subscription Model • Enterprise Generative AI & $1.7B AI Target Catalyst • Economic Moat Analysis & 98% Renewal Rate • Enterprise Total Addressable Market & Competitive Landscape • Q3 Financial Performance: Revenue Beat & EPS Miss • Subscription Growth Outlook & NOW Stock Valuation All the research behind this video was created using Flash by StockSentinel.ai, giving viewers FREE access to investment research reports on any public company. Free features include: ✅ Explainer Videos ✅ Audio Podcasts ✅ Detailed Reports ✅ Investor Presentations with full qualitative and quantitative analysis Subscribers also unlock: ✅ Best Ideas Now (6 highest-conviction picks every Saturday) ✅ Portfolio Watch ✅ Insider IQ (alerts on significant global insider buying activity) ✅ Flash Community Subscribe + 🔔 to never miss a stock report DISCLAIMER: This content is for informational and educational purposes only and is not investment advice. Opinions are personal and may change. Do your own research or consult a licensed professional. StockSentinel.ai is under no obligation to update this information. #StockAnalysis #StockMarket #Investing #Stocks #ValueInvesting #StockResearch #InvestmentAnalysis #FinancialAnalysis #NOW #ServiceNow #NOWStock #NOWAnalysis #TechStocks #AIStocks #DeepDive #FundamentalAnalysis #ValuationAnalysis #WallStreet #NYSE

  • Monday · 11 min· Video

    The $994M Refund Masking Target’s Real Earnings

    Target (TGT) stock analysis: 97% store fulfillment hides a $1B catalyst — buy or sell 👉 Want this level of research on ANY COMPANY IN THE WORLD... for FREE? Check us out at: https://flash.stocksentinel.ai/?utm_source=rss_video&utm_medium=explainer_video&utm_campaign=freja_and_friends In this deep dive, we break down Target Corporation (TGT) and how its 97% store-fulfilled omnichannel model and $915 million Roundel advertising platform are reshaping retail margins. With shares trading at 14.8 times forward earnings and Q2 net sales growing 5.3% YoY to $26.54 billion, the key question for investors is whether high-margin digital monetizations can offset discretionary spending headwinds. Here’s everything you need to know before making a decision on TGT. 🎯 SECTIONS: • Executive Summary & Business Overview • Revenue Channels & Merchandise Mix • Stores-as-Hubs & Roundel Advertising Moat • Competitive Analysis: Target vs. Walmart & Amazon • Q2 FY2026 Financial Results & Earnings Breakdown • 5-Year Valuation Scenario Analysis (Base, Bull, Bear) • Qualitative Scorecard & Investment Thesis • Technical Analysis & Stock Outlook All the research behind this video was created using Flash by StockSentinel.ai. Flash gives viewers FREE access to investment research reports on any public company. The FREE features include: ✅ Explainer Videos ✅ Audio Podcasts ✅ Detailed Reports ✅ Investor Presentations with full qualitative and quantitative analysis Subscribers also unlock: ✅ Best Ideas Now (6 highest-conviction picks every Saturday) ✅ Portfolio Watch ✅ Insider IQ (alerts on significant global insider buying activity) ✅ Flash Community Subscribe + 🔔 to never miss a stock report DISCLAIMER: This content is for informational and educational purposes only and is not investment advice. Opinions are personal and may change. Do your own research or consult a licensed professional. StockSentinel.ai is under no obligation to update this information. #StockAnalysis #StockMarket #Investing #Stocks #ValueInvesting #StockResearch #InvestmentAnalysis #FinancialAnalysis #TGT #Target #TGTStock #TGTAnalysis #ConsumerStocks #Retail #RetailStocks #DeepDive #FundamentalAnalysis #ValuationAnalysis #StockPicks #WallStreet

  • Sunday · 12 min· Video

    LIVN: The Medtech Monopoly Hiding a 73% Valuation Gap

    LIVN stock analysis: 16% EPS beat signals +73% upside — full valuation deep dive 👉 Want this level of research on ANY COMPANY IN THE WORLD... for FREE? Check us out at: https://flash.stocksentinel.ai/?utm_source=rss_video&utm_medium=explainer_video&utm_campaign=freja_and_friends In this deep dive, we break down LivaNova PLC (LIVN) and its strong Q3 2026 earnings surprise, driven by double-digit growth in cardiopulmonary consumables and VNS therapy for epilepsy. With shares trading around 20x forward earnings and constant-currency revenue growing 10% YoY, the key question for investors is whether its $155.88 probability-weighted price target outweighs legacy litigation and expansion execution risks. Here’s everything you need to know before making a decision on LIVN. 🎯 SECTIONS: • Executive Summary & Medtech Business Overview • Cardiopulmonary & Neuromodulation Growth Drivers • Economic Moat, Switching Costs & IP Analysis • Total Addressable Market (TAM) Opportunity • Q3 2026 Earnings Results & Guidance Boost • Wall Street Analyst Ratings & Valuation Framework • Key Execution, Regulatory & Legal Risk Factors • 5-Year Scenario Analysis & Probability-Weighted Price Target • Qualitative Scorecard & Management Alignment • Final Investment Thesis & Technical Analysis Outlook All the research behind this video was created using Flash by StockSentinel.ai, giving you FREE access to investment research reports on any public company in the world. Free features include: ✅ Explainer Videos ✅ Audio Podcasts ✅ Detailed Reports ✅ Investor Presentations with full qualitative and quantitative analysis Subscribers also unlock exclusive features including Best Ideas Now (6 highest-conviction picks every Saturday), Portfolio Watch, Insider IQ alerts on significant global insider buying activity, and the Flash Community. Subscribe + 🔔 to never miss a stock report DISCLAIMER: This content is for informational and educational purposes only and is not investment advice. Opinions are personal and may change. Do your own research or consult a licensed professional. StockSentinel.ai is under no obligation to update this information. #StockAnalysis #StockMarket #Investing #Stocks #ValueInvesting #StockResearch #InvestmentAnalysis #FinancialAnalysis #LIVN #LivaNova #LIVNStock #HealthcareStocks #MedTech #DeepDive #FundamentalAnalysis #ValuationAnalysis #StockPicks #WallStreet #NASDAQ

  • Sunday · 13 min· Video

    SK Hynix Trades at 4x Earnings Despite 80% AI Margins

    SK hynix stock analysis: 80% margin signals AI leadership — semiconductor valuation breakdown 👉 Want this level of research on ANY COMPANY IN THE WORLD... for FREE? Check us out at: https://flash.stocksentinel.ai/?utm_source=rss_video&utm_medium=explainer_video&utm_campaign=freja_and_friends In this deep dive, we break down SK hynix Inc. (000660.KS) and its structural dominance in High-Bandwidth Memory (HBM) technology driving generative AI compute. With shares trading at just 4.68 times forward earnings while operating margins expand to a record 80%, the key question for investors is whether its technical packaging moat supports long-term valuation upside or if cyclical hyperscaler capex risks loom. Here’s everything you need to know before making a buy or sell decision on 000660.KS. 🎯 SECTIONS: • SK hynix (000660.KS) Business Model & AI Semiconductor Overview • HBM3E & HBM4 Technology Dominance in Generative AI Compute • Economic Moat Analysis: Advanced MR-MUF Packaging Advantages • Semiconductor Market Share Breakdown: SK hynix vs Samsung vs Micron • Record Q3 2026 Financial Performance & Operating Margin Expansion • Shareholder Return Framework: Dividends & Aggressive Share Buybacks • 5-Year Valuation Scenario Analysis: High, Base, and Low Case Trajectories • Macro & Execution Risks: Hyperscaler CapEx & Supply Competition • Final Investment Verdict & Valuation Rating All the research behind this video was created using Flash by StockSentinel.ai. Flash gives viewers FREE access to investment research reports on any public company. Our FREE features include: ✅ Explainer Videos ✅ Audio Podcasts ✅ Detailed Reports ✅ Investor Presentations with full qualitative and quantitative analysis Subscribers also unlock: ✅ Best Ideas Now (6 highest-conviction picks every Saturday) ✅ Portfolio Watch ✅ Insider IQ (alerts on significant global insider buying activity) ✅ Flash Community Subscribe + 🔔 to never miss a stock report DISCLAIMER: This content is for informational and educational purposes only and is not investment advice. Opinions are personal and may change. Do your own research or consult a licensed professional. StockSentinel.ai is under no obligation to update this information. #StockAnalysis #StockMarket #Investing #Stocks #ValueInvesting #StockResearch #InvestmentAnalysis #FinancialAnalysis #000660 #SKhynix #000660Stock #000660Analysis #SemiconductorStocks #TechStocks #AIStocks #DeepDive #FundamentalAnalysis #ValuationAnalysis #StockPicks #WallStreet

  • Sunday · 11 min· Video

    Why DraftKings Stock Crashed 25% on a $700M Bet

    DraftKings (DKNG) stock analysis: $700M bet triggers 25% drop — buy or sell 👉 Want this level of research on ANY COMPANY IN THE WORLD... for FREE? Check us out at: https://flash.stocksentinel.ai/?utm_source=rss_video&utm_medium=explainer_video&utm_campaign=freja_and_friends In this deep dive, we break down DraftKings Inc. (DKNG) and its aggressive $700M capital allocation into prediction markets that triggered a 25% post-earnings sell-off. With shares trading near $20.91 at 1.9x forward EV/Sales and management projecting Adjusted EBITDA to reach $800M–$1.0B in FY 2027, the key question for investors is whether this near-term profit hit offers a compelling buying opportunity or signals ongoing execution risk. Here’s everything you need to know before making a decision on DKNG. 🎯 SECTIONS: • Executive Summary & Business Overview • Core Revenue Drivers: Sportsbook, iGaming & Jackpocket • Predictions Market Growth & DKeX Exchange Strategy • Competitive Moat & Scale Advantages vs. FanDuel • Q3 2026 Financial Results & $700M Investment Impact • FY 2026 & FY 2027 Financial Guidance Breakdown • Major Risks: State Gaming Taxes & Regulation • 5-Year Stock Price Target & Valuation Model • Technical Analysis & Short-Term Price Outlook All the research behind this video was created using Flash by StockSentinel.ai. Flash gives viewers FREE access to investment research reports on any public company. The FREE features include: ✅ Explainer Videos ✅ Audio Podcasts ✅ Detailed Reports ✅ Investor Presentations with full qualitative and quantitative analysis Subscribers also unlock: ✅ Best Ideas Now (6 highest-conviction picks every Saturday) ✅ Portfolio Watch ✅ Insider IQ (alerts on significant global insider buying activity) ✅ Flash Community Subscribe + 🔔 to never miss a stock report DISCLAIMER: This content is for informational and educational purposes only and is not investment advice. Opinions are personal and may change. Do your own research or consult a licensed professional. StockSentinel.ai is under no obligation to update this information. #StockAnalysis #StockMarket #Investing #Stocks #ValueInvesting #StockResearch #InvestmentAnalysis #FinancialAnalysis #DKNG #DraftKings #DKNGStock #DKNGAnalysis #ConsumerStocks #SportsBetting #DeepDive #FundamentalAnalysis #ValuationAnalysis #WallStreet #NASDAQ

  • Saturday · 15 min· Video

    NVIDIA at 20x Earnings Ignores 70% Growth

    NVDA stock analysis: 106% revenue growth hits $96B — full valuation breakdown 👉 Want this level of research on ANY COMPANY IN THE WORLD... for FREE? Check us out at: https://flash.stocksentinel.ai/?utm_source=rss_video&utm_medium=explainer_video&utm_campaign=freja_and_friends In this deep dive, we break down NVIDIA Corporation (NVDA) and its rapid expansion as the primary computing engine for global generative AI infrastructure. With revenue growing 106% year-over-year to $96.2B and shares trading at 20.5 times forward earnings, the key question for investors is whether near-term gross margin pressure will derail its 5-year valuation upside. Here’s everything you need to know before making a decision on NVDA. 🎯 SECTIONS: • Executive Summary & Data Center Revenue Surge • Business Drivers: CUDA Ecosystem & Vera Rubin Architecture • Financial Breakdown: Q2 FY2027 Earnings & Margin Analysis • Competitive Landscape: AMD & Hyperscaler Custom ASICs • Risk Assessment: Supply Chain Commitments & HBM Cost Inflation • 5-Year Scenario Model & $446 Price Target Valuation • Qualitative Scorecard & Final Investment Thesis All the research behind this video was created using Flash by StockSentinel.ai, giving viewers FREE access to investment research reports on any public company. Free features include: ✅ Explainer Videos ✅ Audio Podcasts ✅ Detailed Reports ✅ Investor Presentations with full qualitative and quantitative analysis Subscribers also unlock: ✅ Best Ideas Now (6 highest-conviction picks every Saturday) ✅ Portfolio Watch ✅ Insider IQ (alerts on significant global insider buying activity) ✅ Flash Community Subscribe + 🔔 to never miss a stock report DISCLAIMER: This content is for informational and educational purposes only and is not investment advice. Opinions are personal and may change. Do your own research or consult a licensed professional. StockSentinel.ai is under no obligation to update this information. #StockAnalysis #StockMarket #Investing #Stocks #ValueInvesting #StockResearch #InvestmentAnalysis #FinancialAnalysis #NVDA #NVIDIA #NVDAStock #NVDAAnalysis #TechStocks #AIStocks #SemiconductorStocks #DeepDive #FundamentalAnalysis #ValuationAnalysis #WallStreet

  • Saturday · 11 min· Video

    SanDisk Trades at 8x P/E Despite 437% AI Growth

    SanDisk (SNDK) stock analysis: 175% revenue growth — valuation & buy or sell 👉 Want this level of research on ANY COMPANY IN THE WORLD... for FREE? Check us out at: https://flash.stocksentinel.ai/?utm_source=rss_video&utm_medium=explainer_video&utm_campaign=freja_and_friends In this deep dive, we break down SanDisk Corporation (SNDK) and its explosive expansion in high-density enterprise AI storage following its 2025 spinoff from Western Digital. With revenue growing 175% YoY to $20.25 billion and gross margins expanding to 84.6%, the key question for investors is whether SNDK stock is a buy or sell at an 8.26x TTM P/E multiple or if cyclical memory risks lie ahead. Here’s everything you need to know before making a decision on SNDK. 🎯 SECTIONS: - SanDisk (SNDK) Executive Summary & Spinoff Overview - AI Storage Catalysts & Data Center NAND Flash Demand - Kioxia Joint Venture & New Business Model (NBM) Contracts - Q1 FY2027 Financial Performance & Gross Margin Breakdown - SNDK Stock Valuation, Earnings Multiple & 8-for-1 Stock Split - Key Risks: NAND Memory Cyclicality & Hyperscale Concentration - 5-Year SNDK Stock Price Targets: Bull, Base & Bear Scenarios - Qualitative Scorecard & Final Buy or Sell Investment Verdict All the research behind this video was created using Flash by StockSentinel.ai, providing viewers FREE access to investment research reports on any public company. The FREE features include: ✅ Explainer Videos ✅ Audio Podcasts ✅ Detailed Reports ✅ Investor Presentations with full qualitative and quantitative analysis Subscribers also unlock: ✅ Best Ideas Now (6 highest-conviction picks every Saturday) ✅ Portfolio Watch ✅ Insider IQ (alerts on significant global insider buying activity) ✅ Flash Community Subscribe + 🔔 to never miss a stock report DISCLAIMER: This content is for informational and educational purposes only and is not investment advice. Opinions are personal and may change. Do your own research or consult a licensed professional. StockSentinel.ai is under no obligation to update this information. #StockAnalysis #StockMarket #Investing #Stocks #ValueInvesting #StockResearch #InvestmentAnalysis #FinancialAnalysis #SNDK #SanDisk #SNDKStock #TechStocks #AIStocks #DeepDive #FundamentalAnalysis #ValuationAnalysis #WallStreet #NASDAQ #Finance

  • Saturday · 12 min· Video

    GOGO Stock: 574% Asymmetric Upside as Debt Clears

    GOGO stock analysis: 600% upside potential in LEO satcom pivot — full valuation breakdown 👉 Want this level of research on ANY COMPANY IN THE WORLD... for FREE? Check us out at: https://flash.stocksentinel.ai/?utm_source=rss_video&utm_medium=explainer_video&utm_campaign=freja_and_friends In this deep dive, we break down Gogo Inc. (GOGO) and its strategic transformation from a domestic air-to-ground connectivity provider into a global multi-orbit satellite communications leader. With shares trading at an enterprise value of 5.9x 2026E Adjusted EBITDA alongside exclusive FCC spectrum rights through 2036, the key question for investors is whether high-margin Gogo Galileo LEO subscription growth can offset legacy ATG churn and balance sheet debt. Here’s everything you need to know before making a decision on GOGO. 🎯 SECTIONS: - Business Model & Multi-Orbit Architecture - Satcom Direct & Gogo Galileo LEO Expansion - Exclusive FCC Spectrum Rights & Economic Moat - Addressable Market Expansion vs. Starlink Threat - Q3 2026 Financials & Debt Extension Strategy - Valuation Breakdown & 5.9x EV/EBITDA Multiple - 5-Year Scenario Analysis: Base, High & Low Cases - Key Investment Risks & Final Stock Thesis All the research behind this video was created using Flash by StockSentinel.ai. Flash gives viewers FREE access to investment research reports on any public company. The FREE features include: ✅ Explainer Videos ✅ Audio Podcasts ✅ Detailed Reports ✅ Investor Presentations with full qualitative and quantitative analysis Subscribers also unlock: ✅ Best Ideas Now (6 highest-conviction picks every Saturday) ✅ Portfolio Watch ✅ Insider IQ (alerts on significant global insider buying activity) ✅ Flash Community Subscribe + 🔔 to never miss a stock report DISCLAIMER: This content is for informational and educational purposes only and is not investment advice. Opinions are personal and may change. Do your own research or consult a licensed professional. StockSentinel.ai is under no obligation to update this information. #StockAnalysis #StockMarket #Investing #Stocks #ValueInvesting #StockResearch #InvestmentAnalysis #FinancialAnalysis #GOGO #GogoInc #GOGOStock #GOGOAnalysis #TechStocks #TelecomStocks #DeepDive #FundamentalAnalysis #ValuationAnalysis #StockPicks #WallStreet #NASDAQ

  • November 6 · 12 min· Video

    How PURR Stock Captures Hyperliquid's 99% Fee Burn

    PURR stock analysis: 26% NAV discount signals massive upside — full deep dive 👉 Want this level of research on ANY COMPANY IN THE WORLD... for FREE? Check us out at: https://flash.stocksentinel.ai/?utm_source=rss_video&utm_medium=explainer_video&utm_campaign=freja_and_friends In this deep dive, we break down Hyperliquid Strategies Inc. (PURR) and its rapid emergence as a dominant digital asset treasury holding over 38.9 million HYPE tokens. With shares trading at a 26% discount to net asset value despite reporting $620.6 million in Q1 net income, the key question for investors is whether PURR provides accretive long-term upside or carries elevated crypto volatility and regulatory risks. Here’s everything you need to know before making a decision on PURR. 🎯 SECTIONS: - Business Model & Hyperliquid (HYPE) Treasury Strategy - Operational Revenue & Validator Staking Mechanics - Q1 Earnings Breakdown & $620.6M Net Income Beat - Valuation Analysis: mNAV Premium/Discount Flywheel - Growth Catalysts: Pending FCM License & Protocol Fee Burns - Key Risk Assessment: Custody, Litigation & Volatility - 5-Year Financial Model & Price Target Scenarios All the research behind this video was created using Flash by StockSentinel.ai, giving you FREE access to investment research reports on any public company. Free features include: ✅ Explainer Videos ✅ Audio Podcasts ✅ Detailed Reports ✅ Investor Presentations with full qualitative and quantitative analysis Subscribers also unlock: ✅ Best Ideas Now (6 highest-conviction picks every Saturday) ✅ Portfolio Watch ✅ Insider IQ (alerts on significant global insider buying activity) ✅ Flash Community Subscribe + 🔔 to never miss a stock report DISCLAIMER: This content is for informational and educational purposes only and is not investment advice. Opinions are personal and may change. Do your own research or consult a licensed professional. StockSentinel.ai is under no obligation to update this information. #StockAnalysis #StockMarket #Investing #Stocks #ValueInvesting #StockResearch #InvestmentAnalysis #FinancialAnalysis #PURR #HyperliquidStrategies #PURRStock #PURRAnalysis #FinancialStocks #FintechStocks #DeepDive #FundamentalAnalysis #ValuationAnalysis #WallStreet #NASDAQ #Finance

Showing 1–20 of 237 episodes